Public Health Research Lab
We conduct community-based research focused on health outcomes among underserved and unhoused populations. Students in the lab gain hands-on experience in study design, data analysis, manuscript preparation, and have opportunities to present at academic conferences and contribute to peer-reviewed publications. The lab is led by Sarah Jean Valliant, Founder of Valliant Foundation and Principal Investigator, who oversees research direction and ethics while mentoring student researchers throughout the research process.

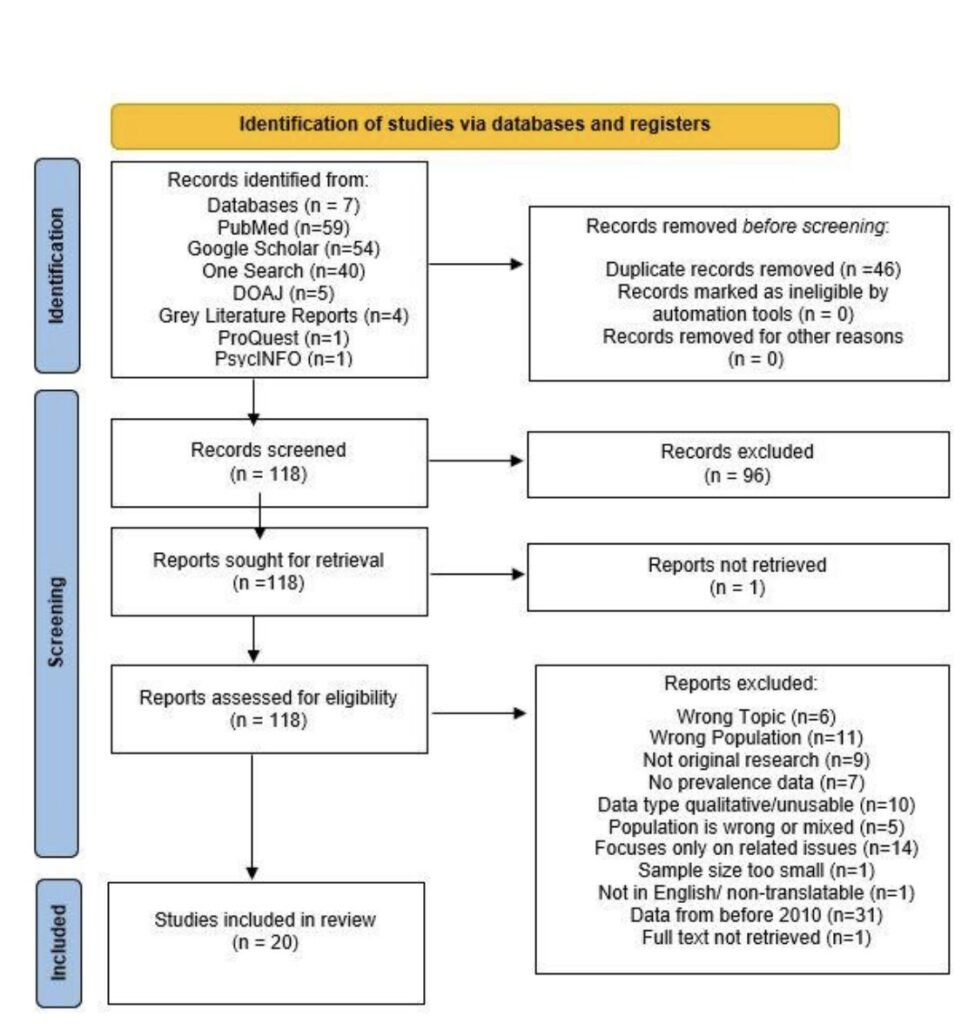
A Meta-Analysis of Sexual Assault Prevalence Among Homeless Women
Valliant SJ, Razumeyko J, Santos A, Parton S, Lee A, Derin J, Banihashem Ahmad N, Kulik C, Banihashem M. Meta-analyses of sexual assault prevalence among homeless women. Manuscript under review. Heliyon. 2025..
Highlights
● Marked Epidemiologic Burden: Nearly 40% of homeless women report lifetime sexual assault.
● Persistent risk: One in five homeless women assaulted within the past 12 months.
● Marginalized Impact: Rates highest among disabled, LGBTQ+, and HIV+ women.
● High Variability: Extreme heterogeneity (I² ≈ 97%) shows research
inconsistency.
● Research Priority: Standardize methods and definitions to improve accuracy.
Cardiovascular health assessments among unsheltered adults: an ethical community-based framework for screening programs
Valliant SJ, Rodriguez IJ, Lee AK, Holbrook LC, Punzalan RR, Modan Y, et al. Cardiovascular health assessments among unsheltered adults: an ethical community-based framework for screen5trqing programs. Manuscript submitted for publication. 2026.
Highlights
● Replicable, ethical methodology improves public health service quality.
● Mandatory capacity screening, informed consent, and emergency protocol used.
● Oversight by ethics committee to ensure compliance with relevant laws and
consent.
● Consideration for direct and quasi-identifiers in data collection and storage.
● Framework integrates emergency protocols respecting autonomy to decline
services.

A Systematic Review of Type 1 Diabetes among the Homeless
Status: In Progress. Author: Valliant et al.
The purpose of this review is to assess interventions, outcomes, prevalence, barriers to care, patient experiences, and research gaps for type 1 diabetics experiencing homelessness.
Methods
This study followed PRISMA guidelines to synthesize eligible peer reviewed studies which reported on interventions, outcomes, prevalence, barriers to care, patient experiences, and research gaps for type 1 diabetics experiencing homelessness. Quality assessment tools were utilized to screen out low quality studies, and each article was screened by two independent reviewers to ensure consistency.
Community Needs Assessment (NHSR)
Please email query.valliant@gmail.com for a copy of our NHSR determination letter.
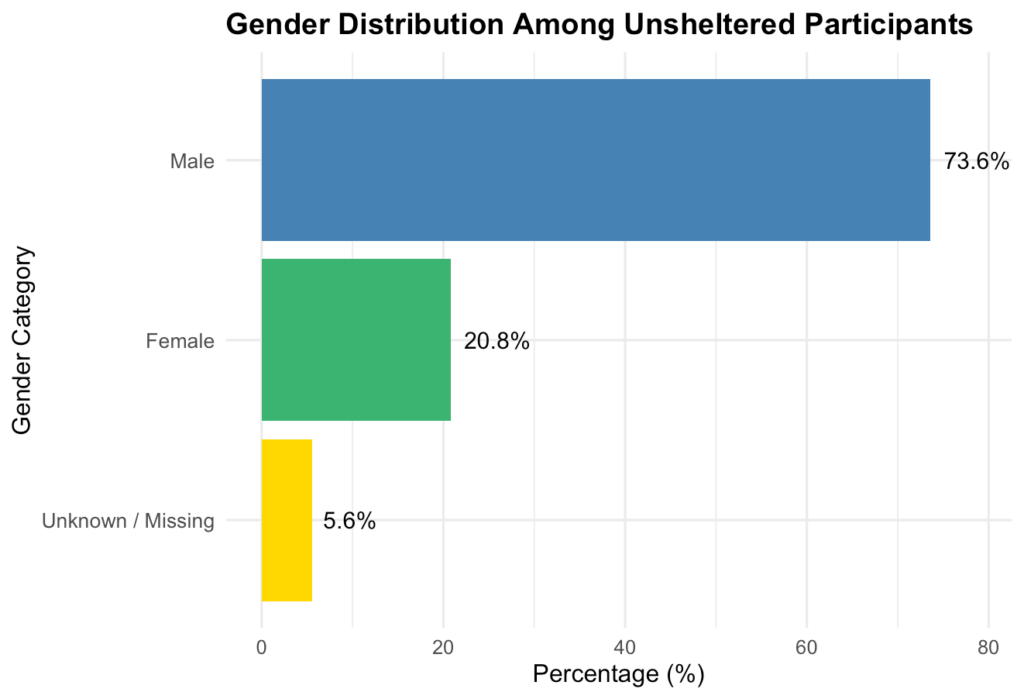
Figure 2. Gender Distribution Among Unsheltered Participants.
The horizontal bar chart displays the gender composition of individuals included in the community needs assessment. Among the 72 participants, 53 (73.6%) identified as male, 15 (20.8%) as female, and 4 (5.6%) had missing or undefined gender information.
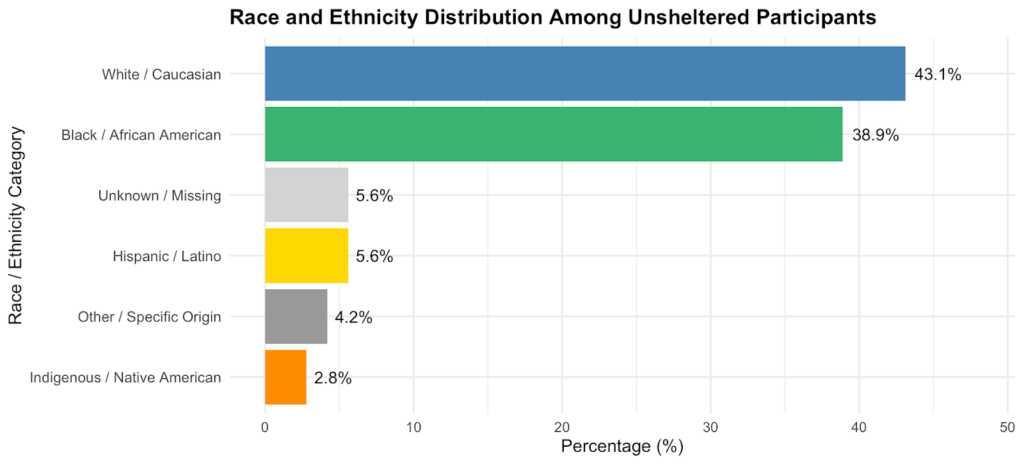
Figure 4. Race and Ethnicity Distribution Among Unsheltered Participants.
Horizontal bar chart illustrating the distribution of racial and ethnic identities among unsheltered participants. The majority identified as White/Caucasian (43.1%) or Black/African American (38.9%), with smaller populations identifying as Hispanic/Latino (5.6%), Indigenous/Native American (2.8%), or Other/Specific Origin (4.2%). Data were missing for four participants (5.6%).
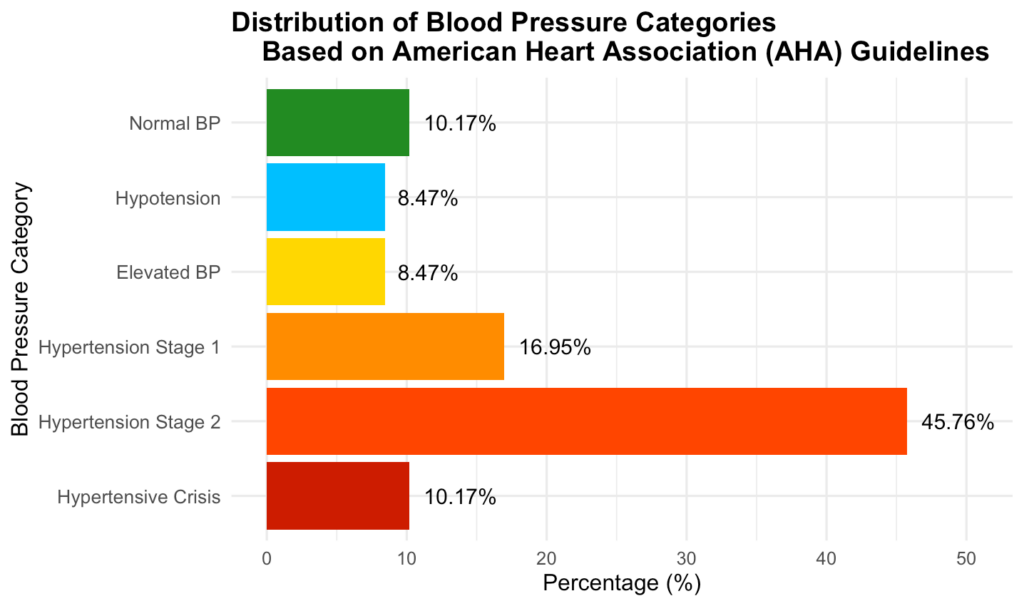
Figure 7. Distribution of Blood Pressure (BP) Categories Among Unsheltered Participants based on American Heart Association (AHA) Guidelines. Of the 72 total participants, 6 (10.17%) were classified as Normal, 5 (8.47%) as Hypotension, 5 (8.47%) as Elevated, 10 (16.95%) as Hypertension Stage 1, 27 (45.76%) as Hypertension Stage 2, and 6 (10.17%) as Hypertensive Crisis. Twelve participants had missing or unclassifiable readings.
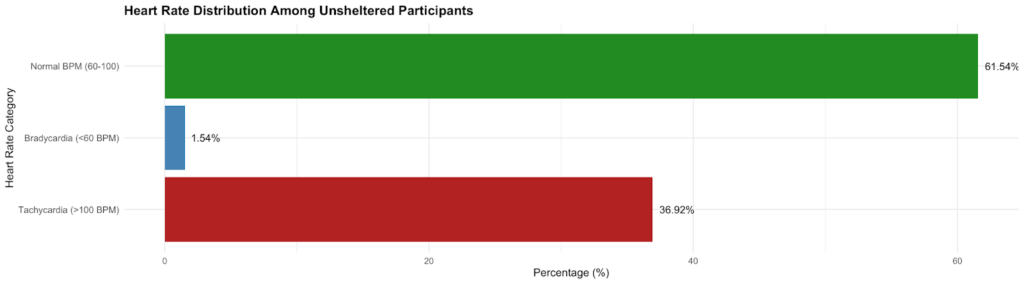
Figure 8. Distribution of Heart Rate Categories Among Unsheltered Participants. The horizontal bar graph illustrates the distribution of heart rate categories among unsheltered participants. From the data, 40 participants (61.54%) had heart rates within the normal range (60-100 bpm), 24 participants (36.92%) exhibited tachycardia (>100 bpm), and 1 participant (1.54%) exhibited bradycardia (<60 bpm). Heart rate data were missing or unclassifiable for 7 participants.
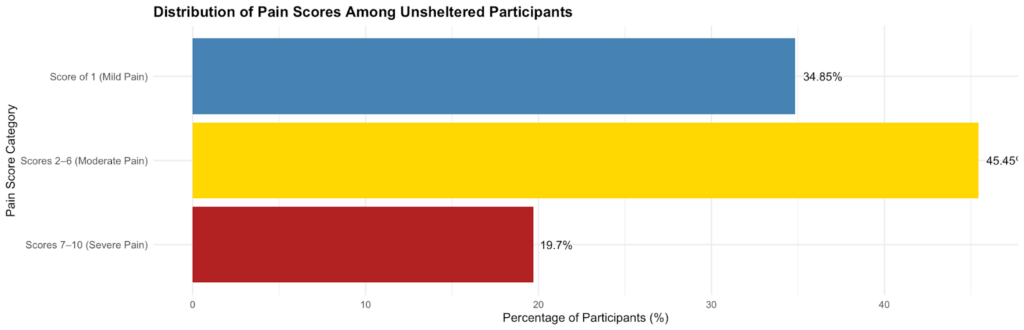
Figure 9. Distribution of Pain Scores Among Unsheltered Participants. The horizontal bar graph illustrates the distribution of pain scores among unsheltered participants. From the data, 23 participants (34.85%) had a mild pain score of 1, 30 participants (45.45%) had a moderate pain score between 2-6, and 13 participants (19.7%) reported having a severe pain score between 7-10. Pain score data were missing or unclassifiable for 6 participants.


Geospatial Solutions for Homelessness
Valliant Foundation’s Geospatial Analysis Department leverages advanced mapping and location-based technologies to support the organization’s mission of addressing homelessness in San Francisco. By utilizing geospatial modeling tools such as Geographic Information Systems, the department analyzes data to identify patterns, trends, and gaps in service delivery for the homeless population. Key activities include mapping high-density areas of homelessness, tracking resource availability, and assessing environmental factors impacting unhoused individuals.
This data-driven approach enables more effective deployment of resources, informed decision-making, and collaboration with local authorities, NGOs, and community stakeholders. The department also produces visualizations and reports that highlight the intersection of homelessness with urban development, public health, and social services. Through innovative geospatial strategies, the department plays a pivotal role in crafting targeted interventions and measuring the impact of the foundation’s initiatives.
Geographic Modeling and Analysis of the October 26 2024, Outreach Mission.
Maps


Mapping (Supplies Only – 39 Interactions)


Mapping (Supplies Only – 39 Interactions)


Mapping (Supplies & Medical – 24 Interactions)
Valliant Foundation conducts vital sign assessments, including heart rate, blood pressure, oxygen saturation, temperature, and lung sounds. We also gather data on perceived stress and physical pain using numerical scales, and when necessary, document suicide risk assessments to ensure comprehensive care and support.


Mapping (Service Declined – 10 Interactions)
Analytics


Authors: Hyojin Byun, Ivy Wang, Collin Rizk, Benya Vishnevetski
Editor: Benya Vishnevetski
Data Collection: Sean Velasquez, Sarah Valliant, Maya Barbosa, Jesus Salcedo, Hiro, Malia Gomez
Chief Geospatial Analyst: Ivy Wang
Outreach Supervisor: Sean Velasquez
Program Director: Benya Vishnevetski
Published: December 5, 2024.
Mapping Impact
Geospatial Analysis Outreach Mission 10/26
The maps presented in this section are a cornerstone of Valliant Foundation’s efforts to address homelessness in San Francisco. By overlaying pinpoint data collected by our dedicated outreach volunteers onto detailed street maps of the city, we provide a dynamic visual representation of where and how our initiatives are making an impact.
Each pinpoint corresponds to an interaction with individuals experiencing homelessness, marking the type of assistance provided—be it the distribution of food and supplies, access to healthcare, or other critical services. This mapping approach not only tracks the scope of our efforts but also highlights geographic patterns and areas where resources are most needed.
These maps serve as a living document, continuously updated with real-time data to guide our strategy and improve our outreach. By understanding the spatial dimensions of homelessness and the distribution of our services, we aim to foster a more equitable allocation of resources and a deeper connection with the communities we serve.
From Data to Impact
The October 26th, 2024, outreach mission highlights Valliant Foundation’s strategic application of geospatial analysis in addressing homelessness in San Francisco. By mapping interactions and analyzing service distribution, the mission provided valuable insights into resource allocation, community needs, and service gaps. These findings are instrumental in refining outreach strategies to enhance efficiency and equity.
The mission underscores the foundation’s dual commitment to data-driven precision and human-centered care, balancing the delivery of essential supplies and medical assessments with respect for individual autonomy. By integrating advanced geospatial methodologies with a compassionate approach, Valliant Foundation continues to set a benchmark for impactful interventions for its beneficiaries. As the organization advances its initiatives, it remains steadfast in fostering collaboration, driving innovation, and advocating for systemic solutions to combat homelessness.